Most analytics products stop at the number
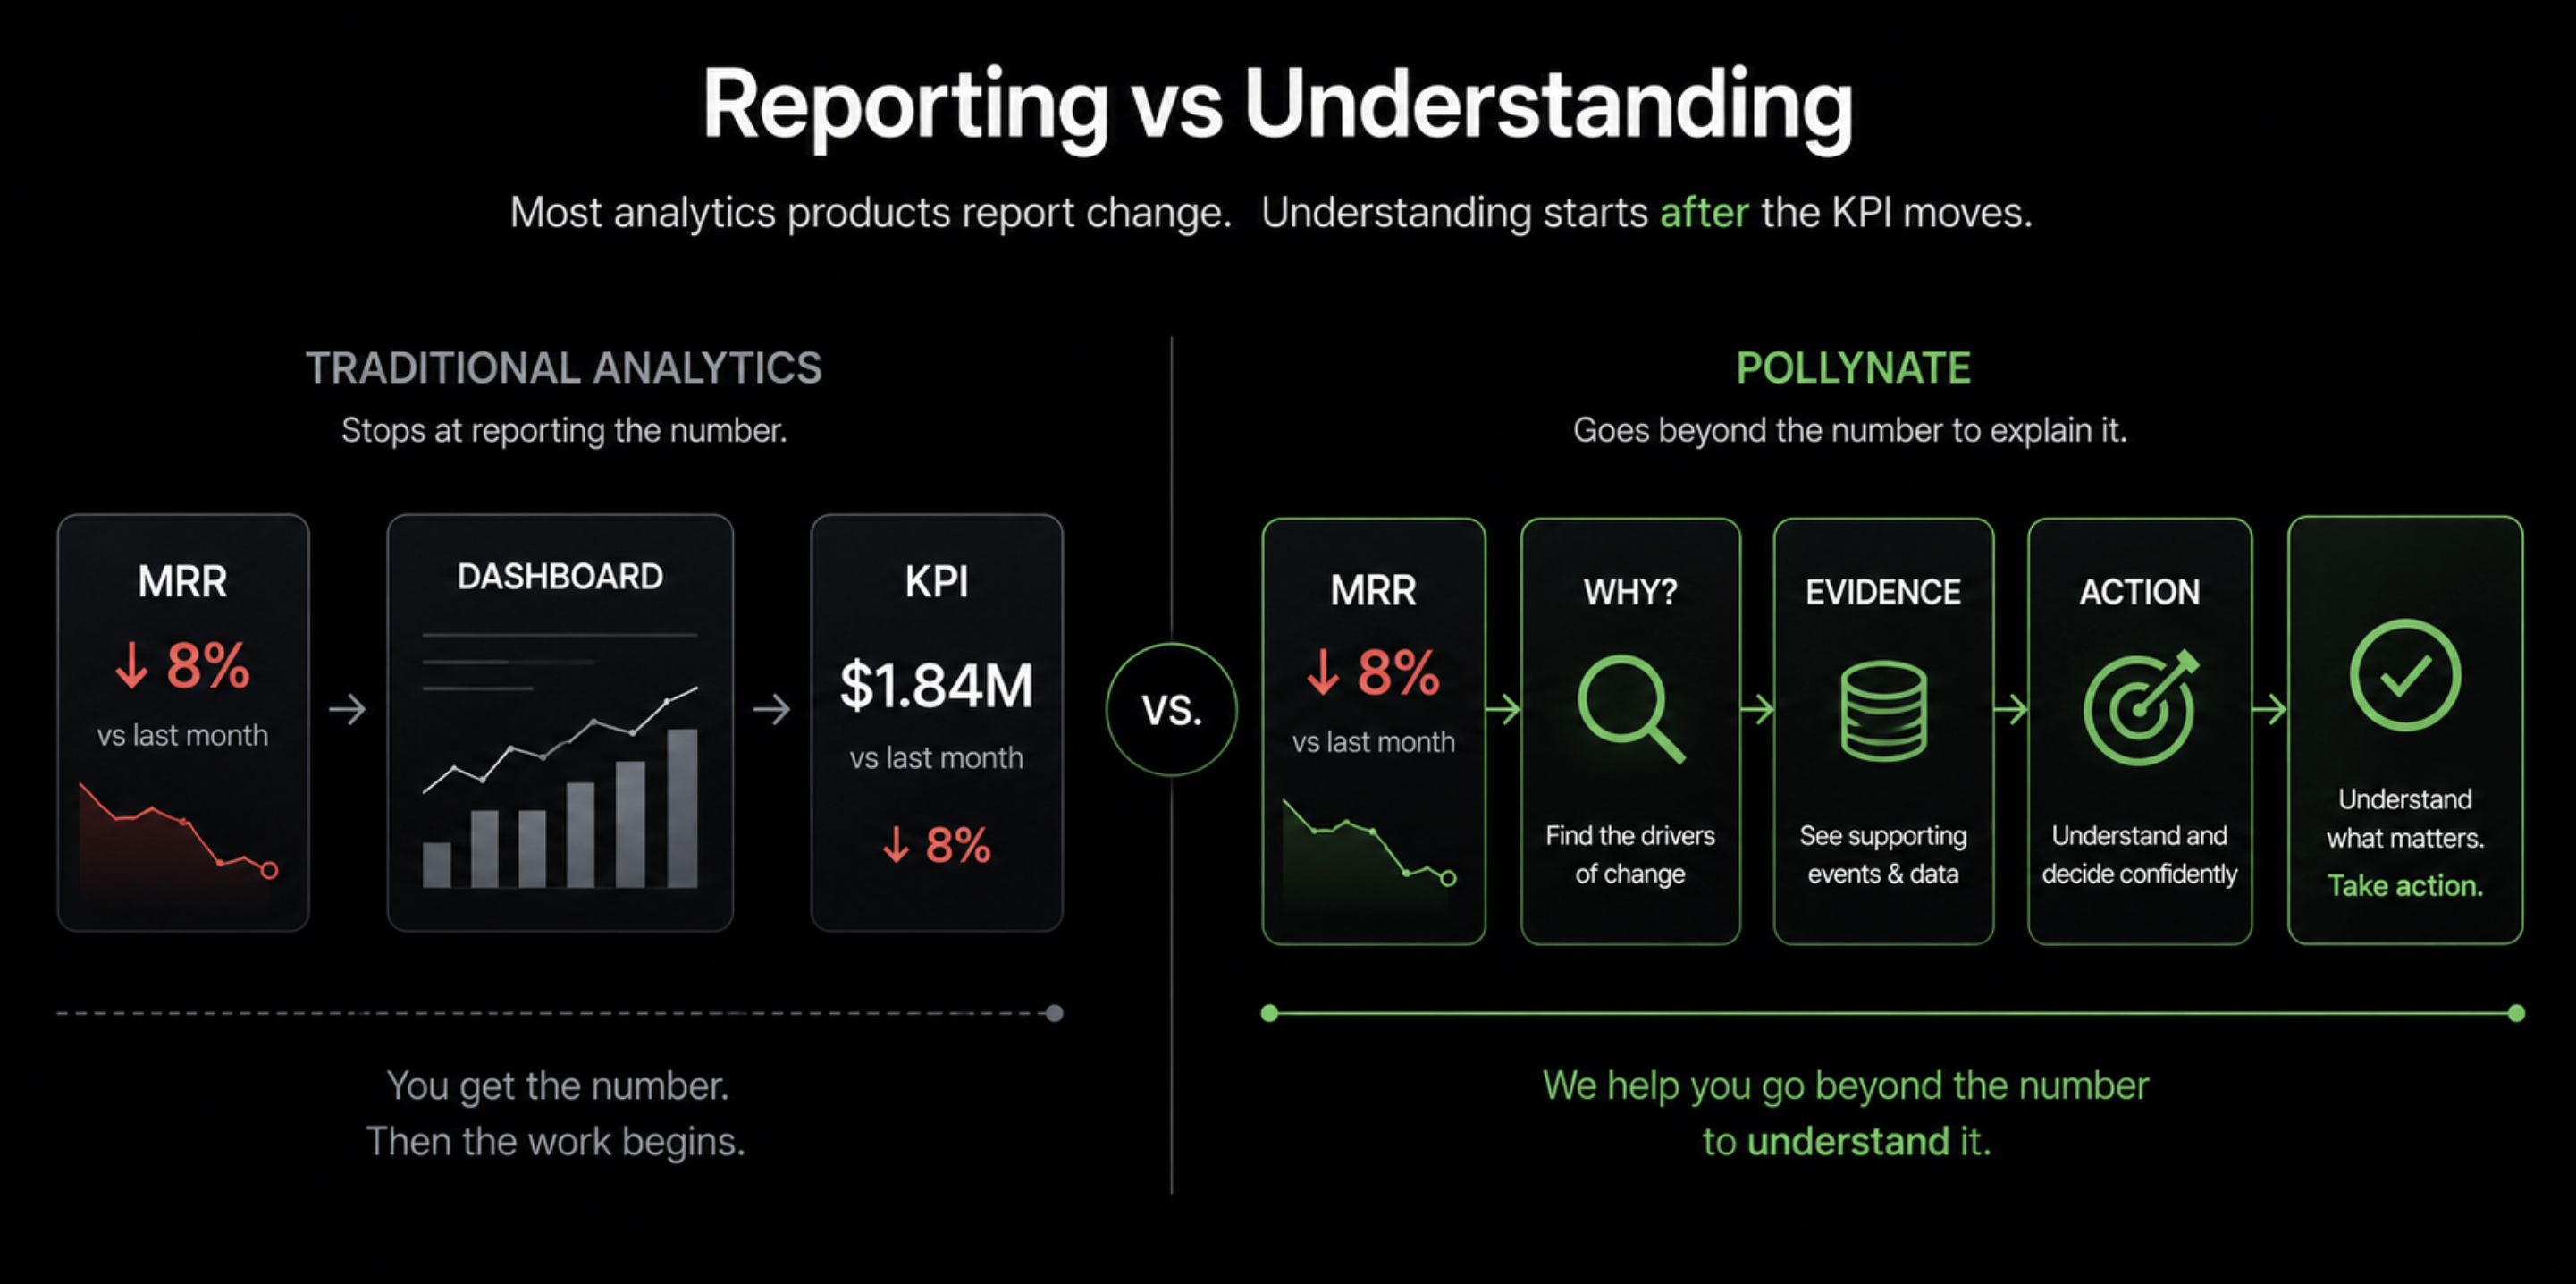
Most analytics products are good at telling you what happened.
Revenue is up.
Churn is down.
MRR moved 8%.
The dashboard did its job.
Or at least that is how the category usually defines the job.
I think that definition is too small.
The real work starts after the KPI changes.
That is the idea behind Pollynate.
We are not trying to build another place to look at metrics.
Most companies do not suffer from a shortage of numbers.
They suffer from a shortage of understanding.
Business users rarely wake up and think:
"If only I had one more dashboard."
They ask:
Why did this change?
What caused it?
Which customers drove it?
Is this a real business event or a data issue?
What should I do next?
Those are not reporting questions.
They are understanding questions.
The metric is usually not the problem
If you walk into a modern company, you will find no shortage of reporting.
There is a BI tool.
There is a warehouse.
There are Stripe exports.
There are Slack screenshots.
There is usually at least one spreadsheet everyone secretly trusts more than the dashboard.
The problem is not reporting.
The problem is what happens when a number moves and nobody knows why.
That is the moment analytics stops being about presentation and starts being about investigation.
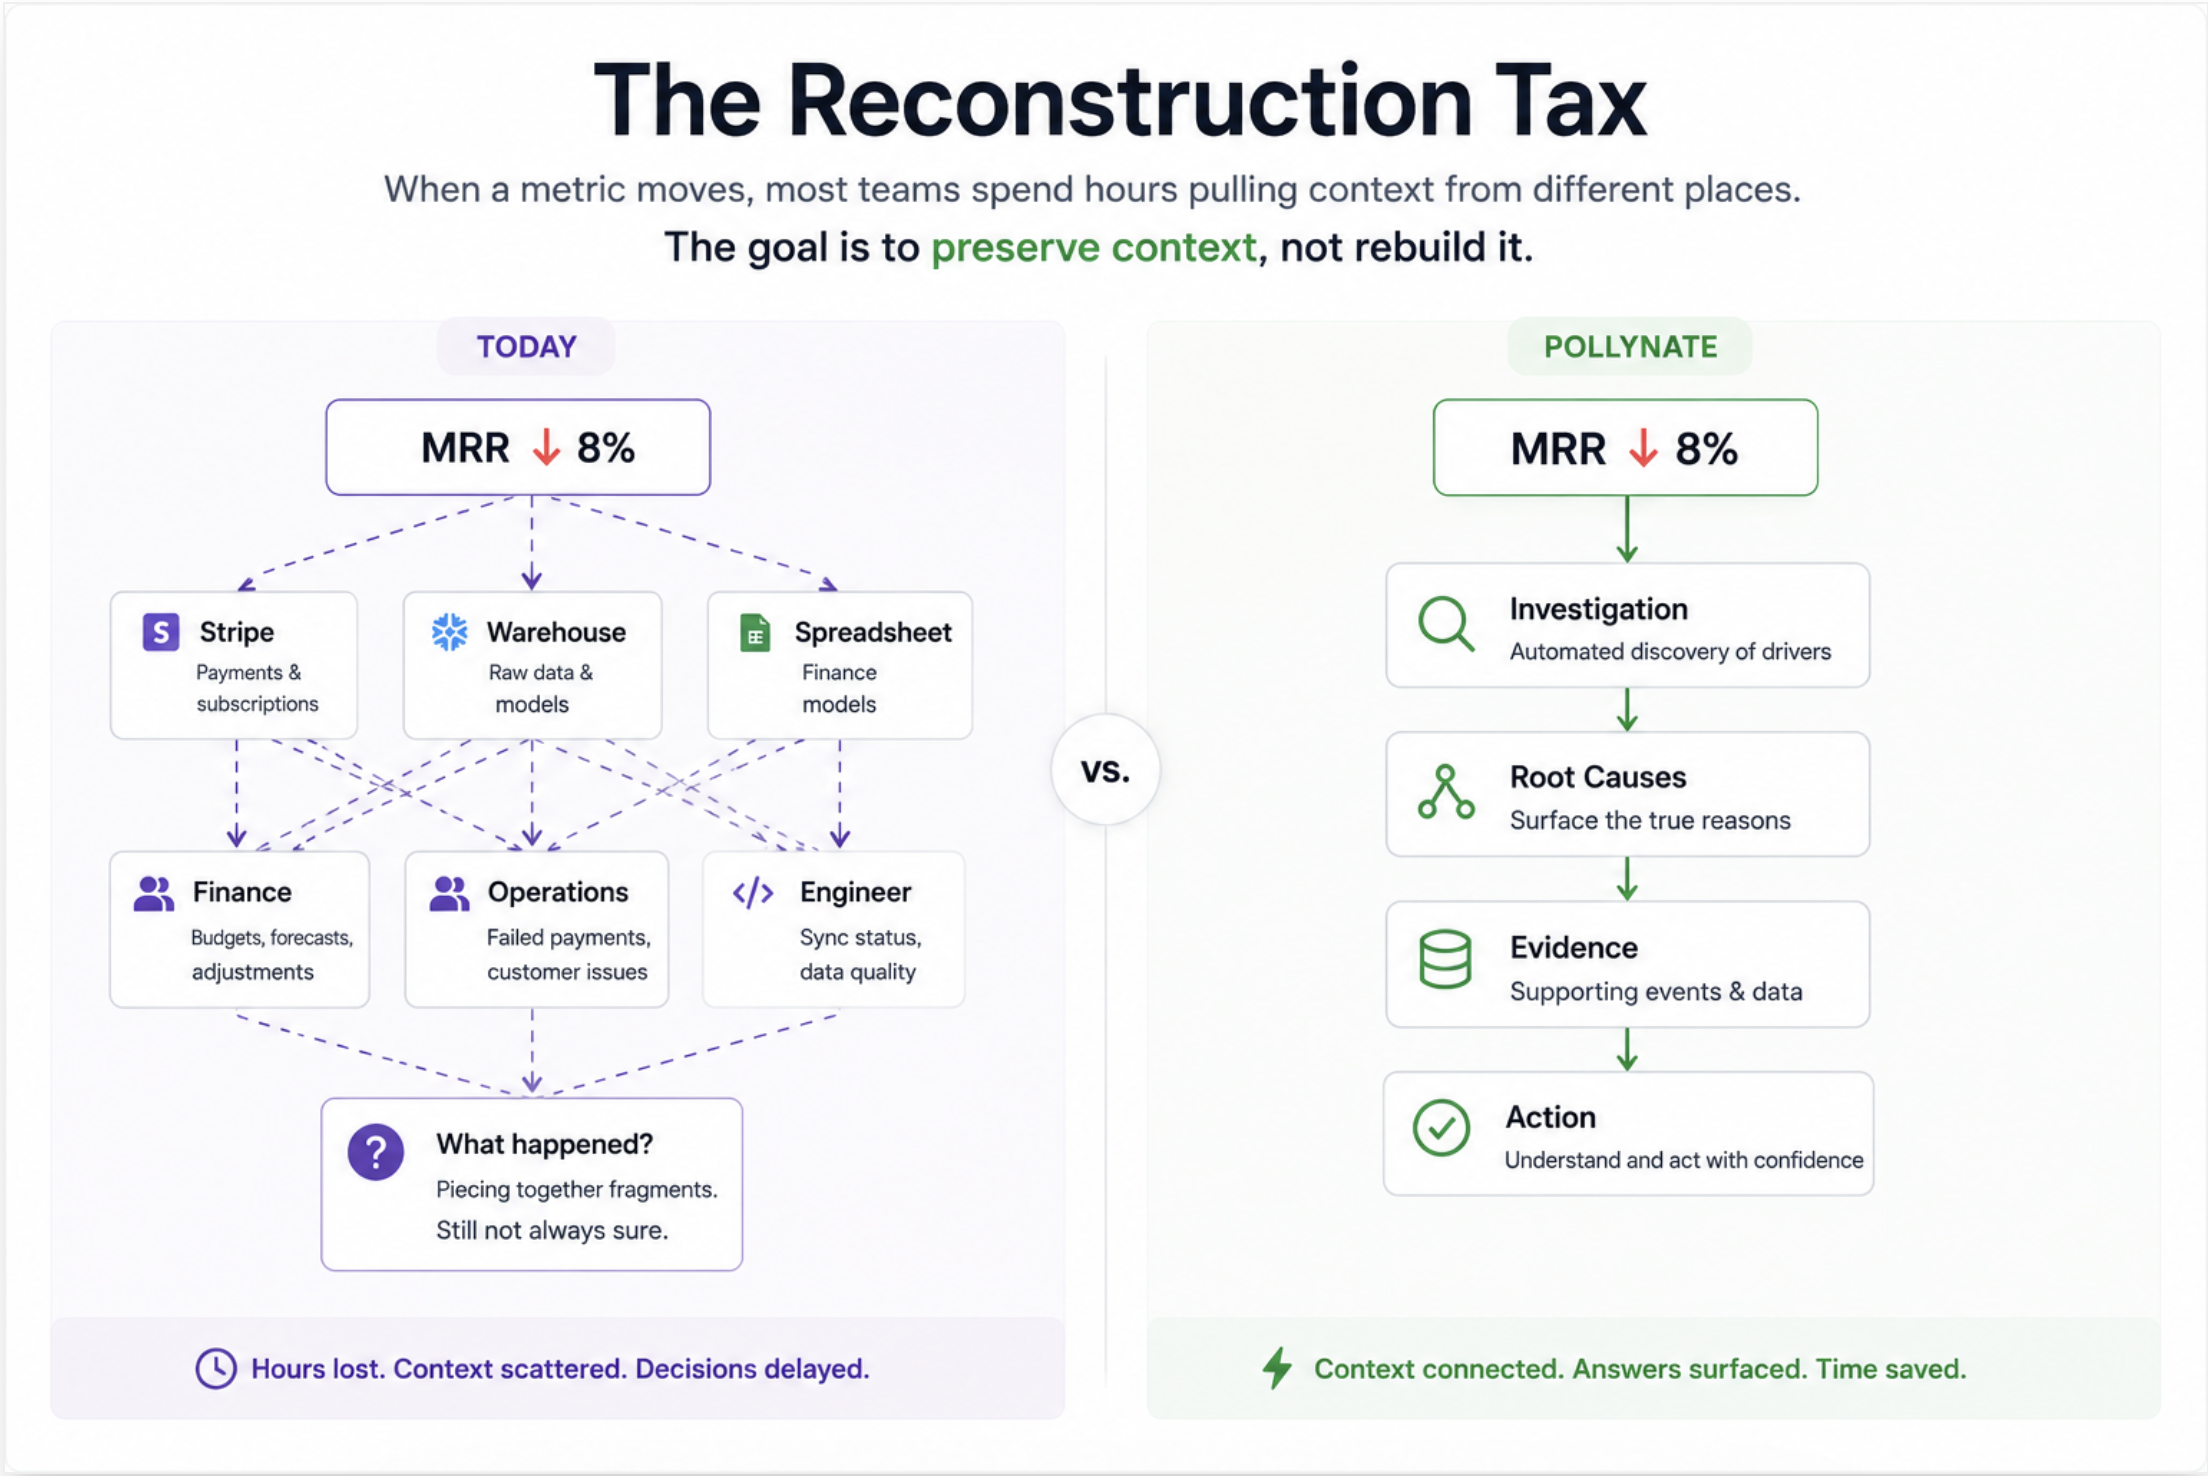
A founder opens a dashboard on Monday morning and sees MRR down 8%.
The number is useful.
It is also incomplete.
Most tools will do a respectable job of presenting the drop.
Maybe there is a chart.
Maybe there is a comparison to last week.
Maybe there is a red arrow making the problem feel urgent.
But the founder's next question arrives immediately:
Why?
And this is where most products quietly hand the work back to the user.
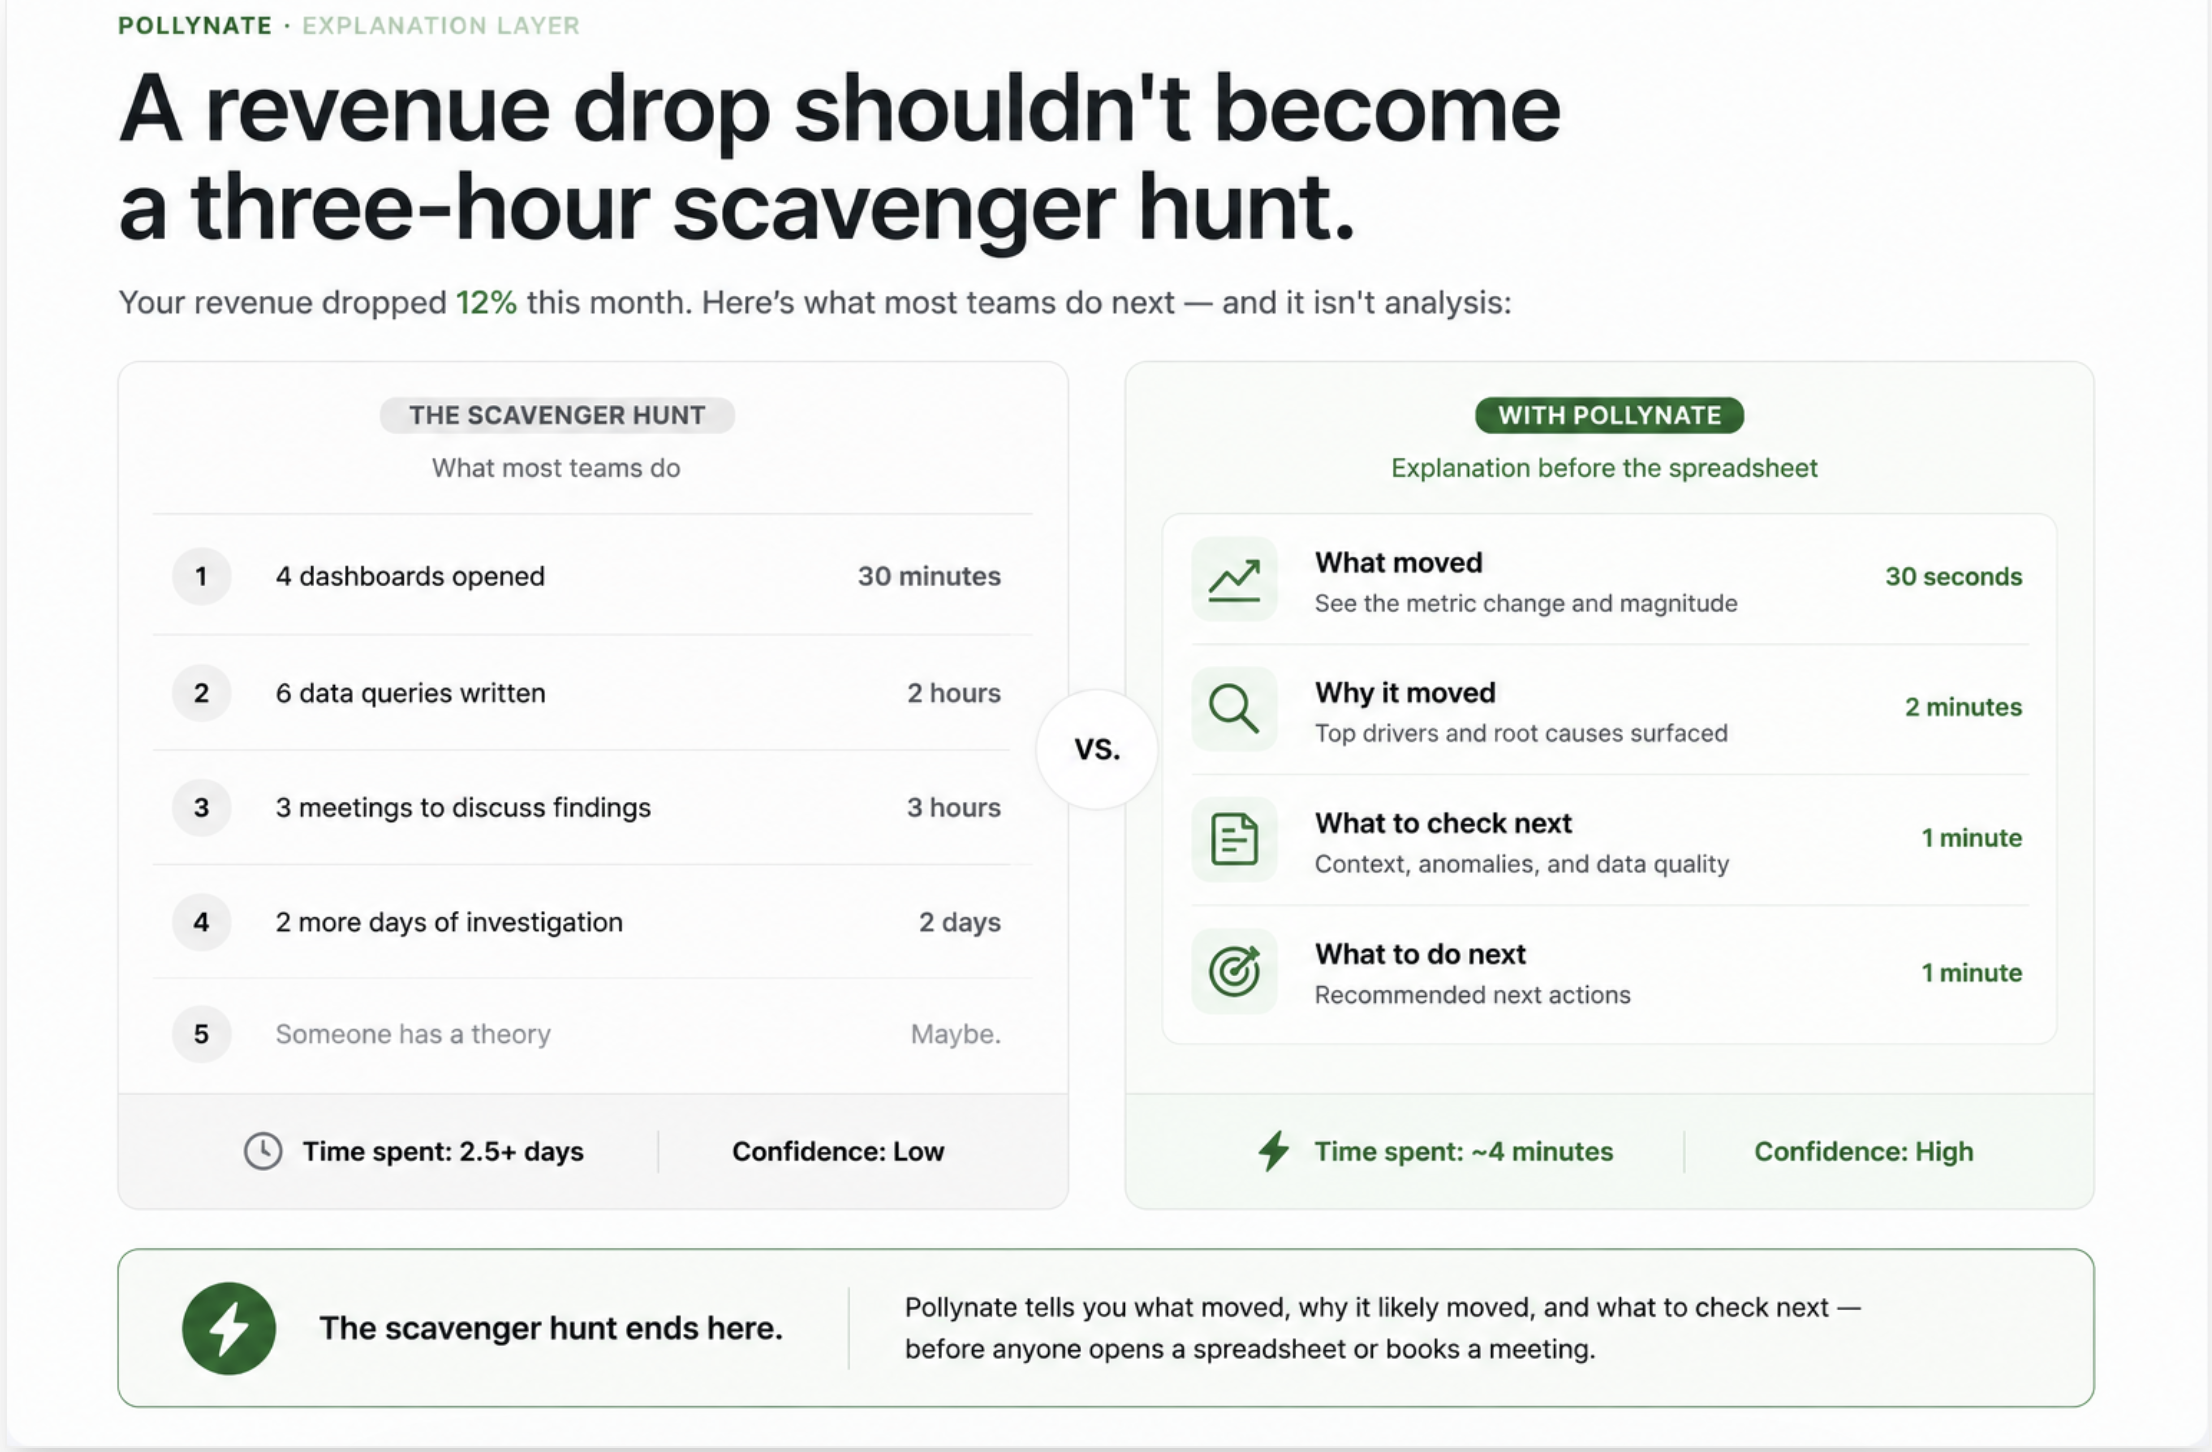
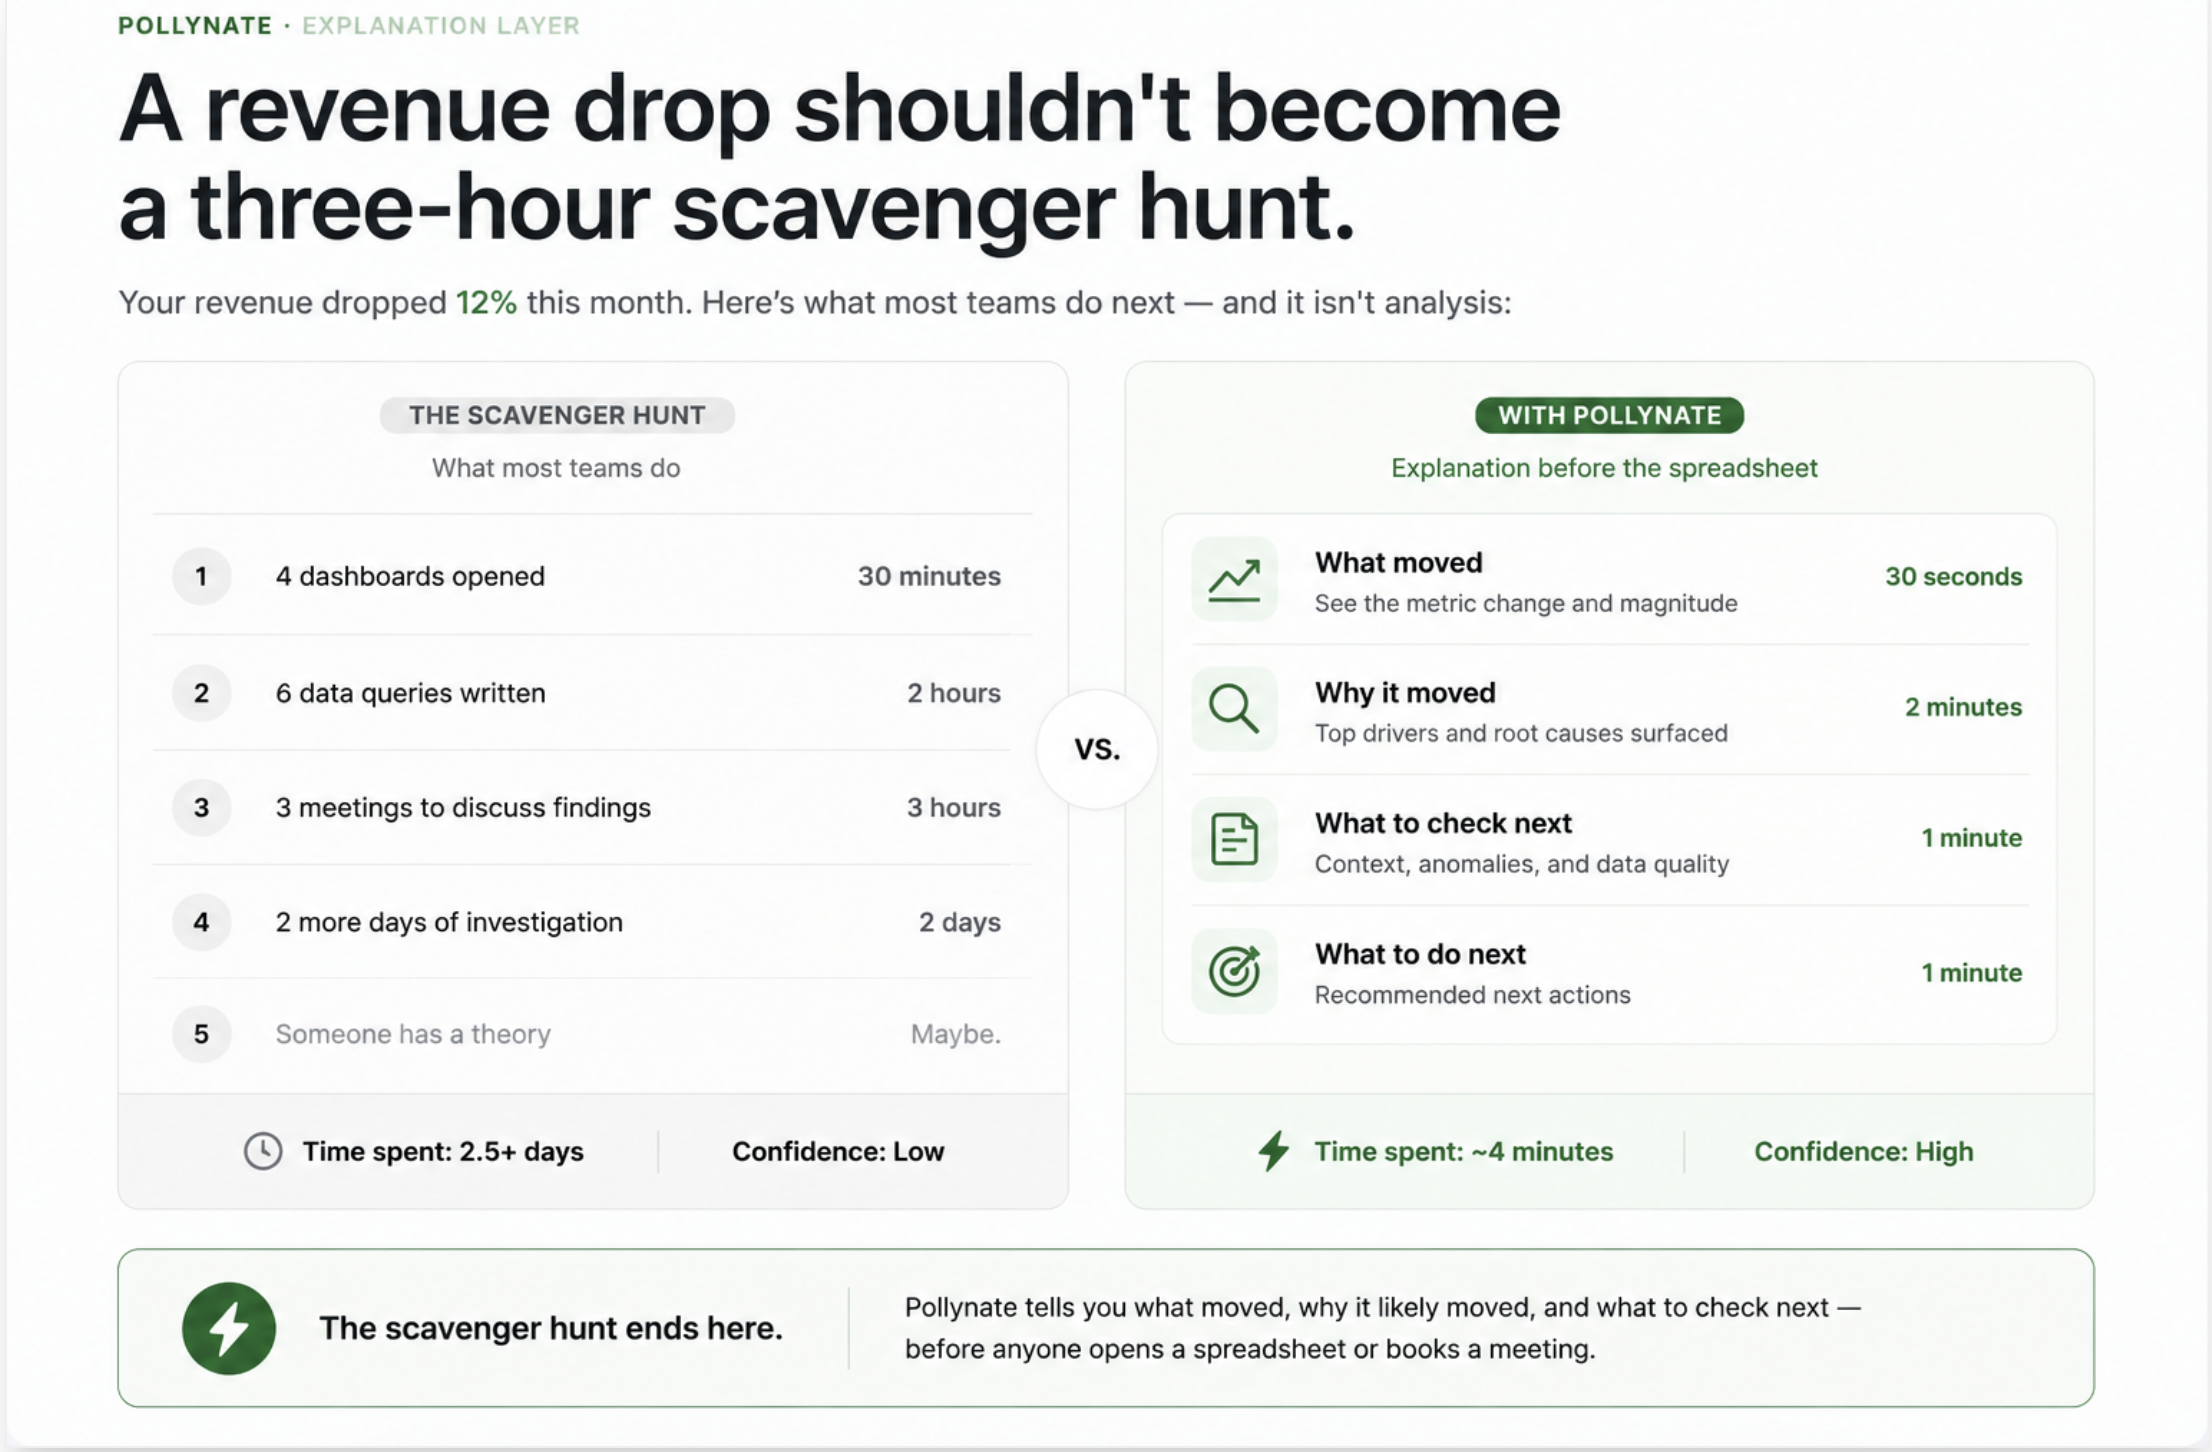
Someone opens Stripe.
Someone checks the warehouse.
Finance pulls a spreadsheet.
Operations investigates failed payments.
An engineer gets asked whether the sync broke.
An hour later the company has fragments of an answer.
The number was never the hard part.
The hard part was reconstructing the context around it.
Most products stop where the interesting questions begin
The industry has spent years getting better at compressing reality into a metric.
That work mattered.
But a metric is not the end of the reasoning process.
It is the beginning.
When revenue drops, a team does not need admiration for the chart.
It needs explanation.
Which customers moved the number?
Was it concentrated or broad?
Was it churn, contraction, failed collections, refunds, or timing?
How confident should we be?
What should we do next?
This is the core belief behind Pollynate:
Understanding is the product.
Not trust for its own sake.
Not infrastructure for its own sake.
Not reporting for its own sake.
Understanding.
Explainability is the mechanism
If understanding is the outcome, explainability is the mechanism.
When a number changes, the product should help a user move from the metric to the reasons behind it with as little reconstruction as possible.
It should preserve context close to the number.
It should keep the chain of reasoning intact.
It should make the next question easy.
That means a KPI should remain connected to the customers, subscription events, payment failures, model logic, and system state that produced it.
Analytics should show its work.
Not because users want a lecture.
Because they want to make decisions.
The difference matters.
Most teams are not asking for more detail out of curiosity.
They are trying to decide whether to call a customer, revise a forecast, investigate churn, or ignore a false signal.
Good explanation shortens that path.
Bad explanation turns the company into a temporary detective agency.
What Pollynate is trying to preserve
If a founder sees MRR down 8%, I do not want the product to stop at the number.
I want it to preserve the surrounding context that makes the number intelligible.
Maybe the drop is mostly explained by three subscription downgrades.
Maybe it is failed collections that are likely recoverable.
Maybe a refund batch landed late.
Maybe the movement is real but the latest sync is still reconciling.
Those situations imply very different actions.
Call the account team.
Recover involuntary churn.
Wait for the sync window.
Investigate a specific cohort.
The product should help users distinguish between them.
That is why we care about evidence, lineage, sync visibility, and reconciliation.
Not because those concepts are the headline.
They are supporting layers.
They exist to make explanation possible.
Trust is not the destination.
Trust enables understanding.
Reliability is a supporting layer, not the story
Reliability matters.
Every serious analytics product should care about it.
But reliability is not the user outcome.
A perfectly reliable black box is still a black box.
The higher bar is not:
"Is the pipeline correct?"
The higher bar is:
"Can the user understand what changed and why without leaving the product to reconstruct the answer elsewhere?"
That is a product question.
Not just an architecture question.
What I hope this becomes
The ambition for Pollynate is straightforward.
When a business user sees a number move, I want their first instinct to be curiosity, not suspicion.
I want the product to help them answer the practical questions that follow:
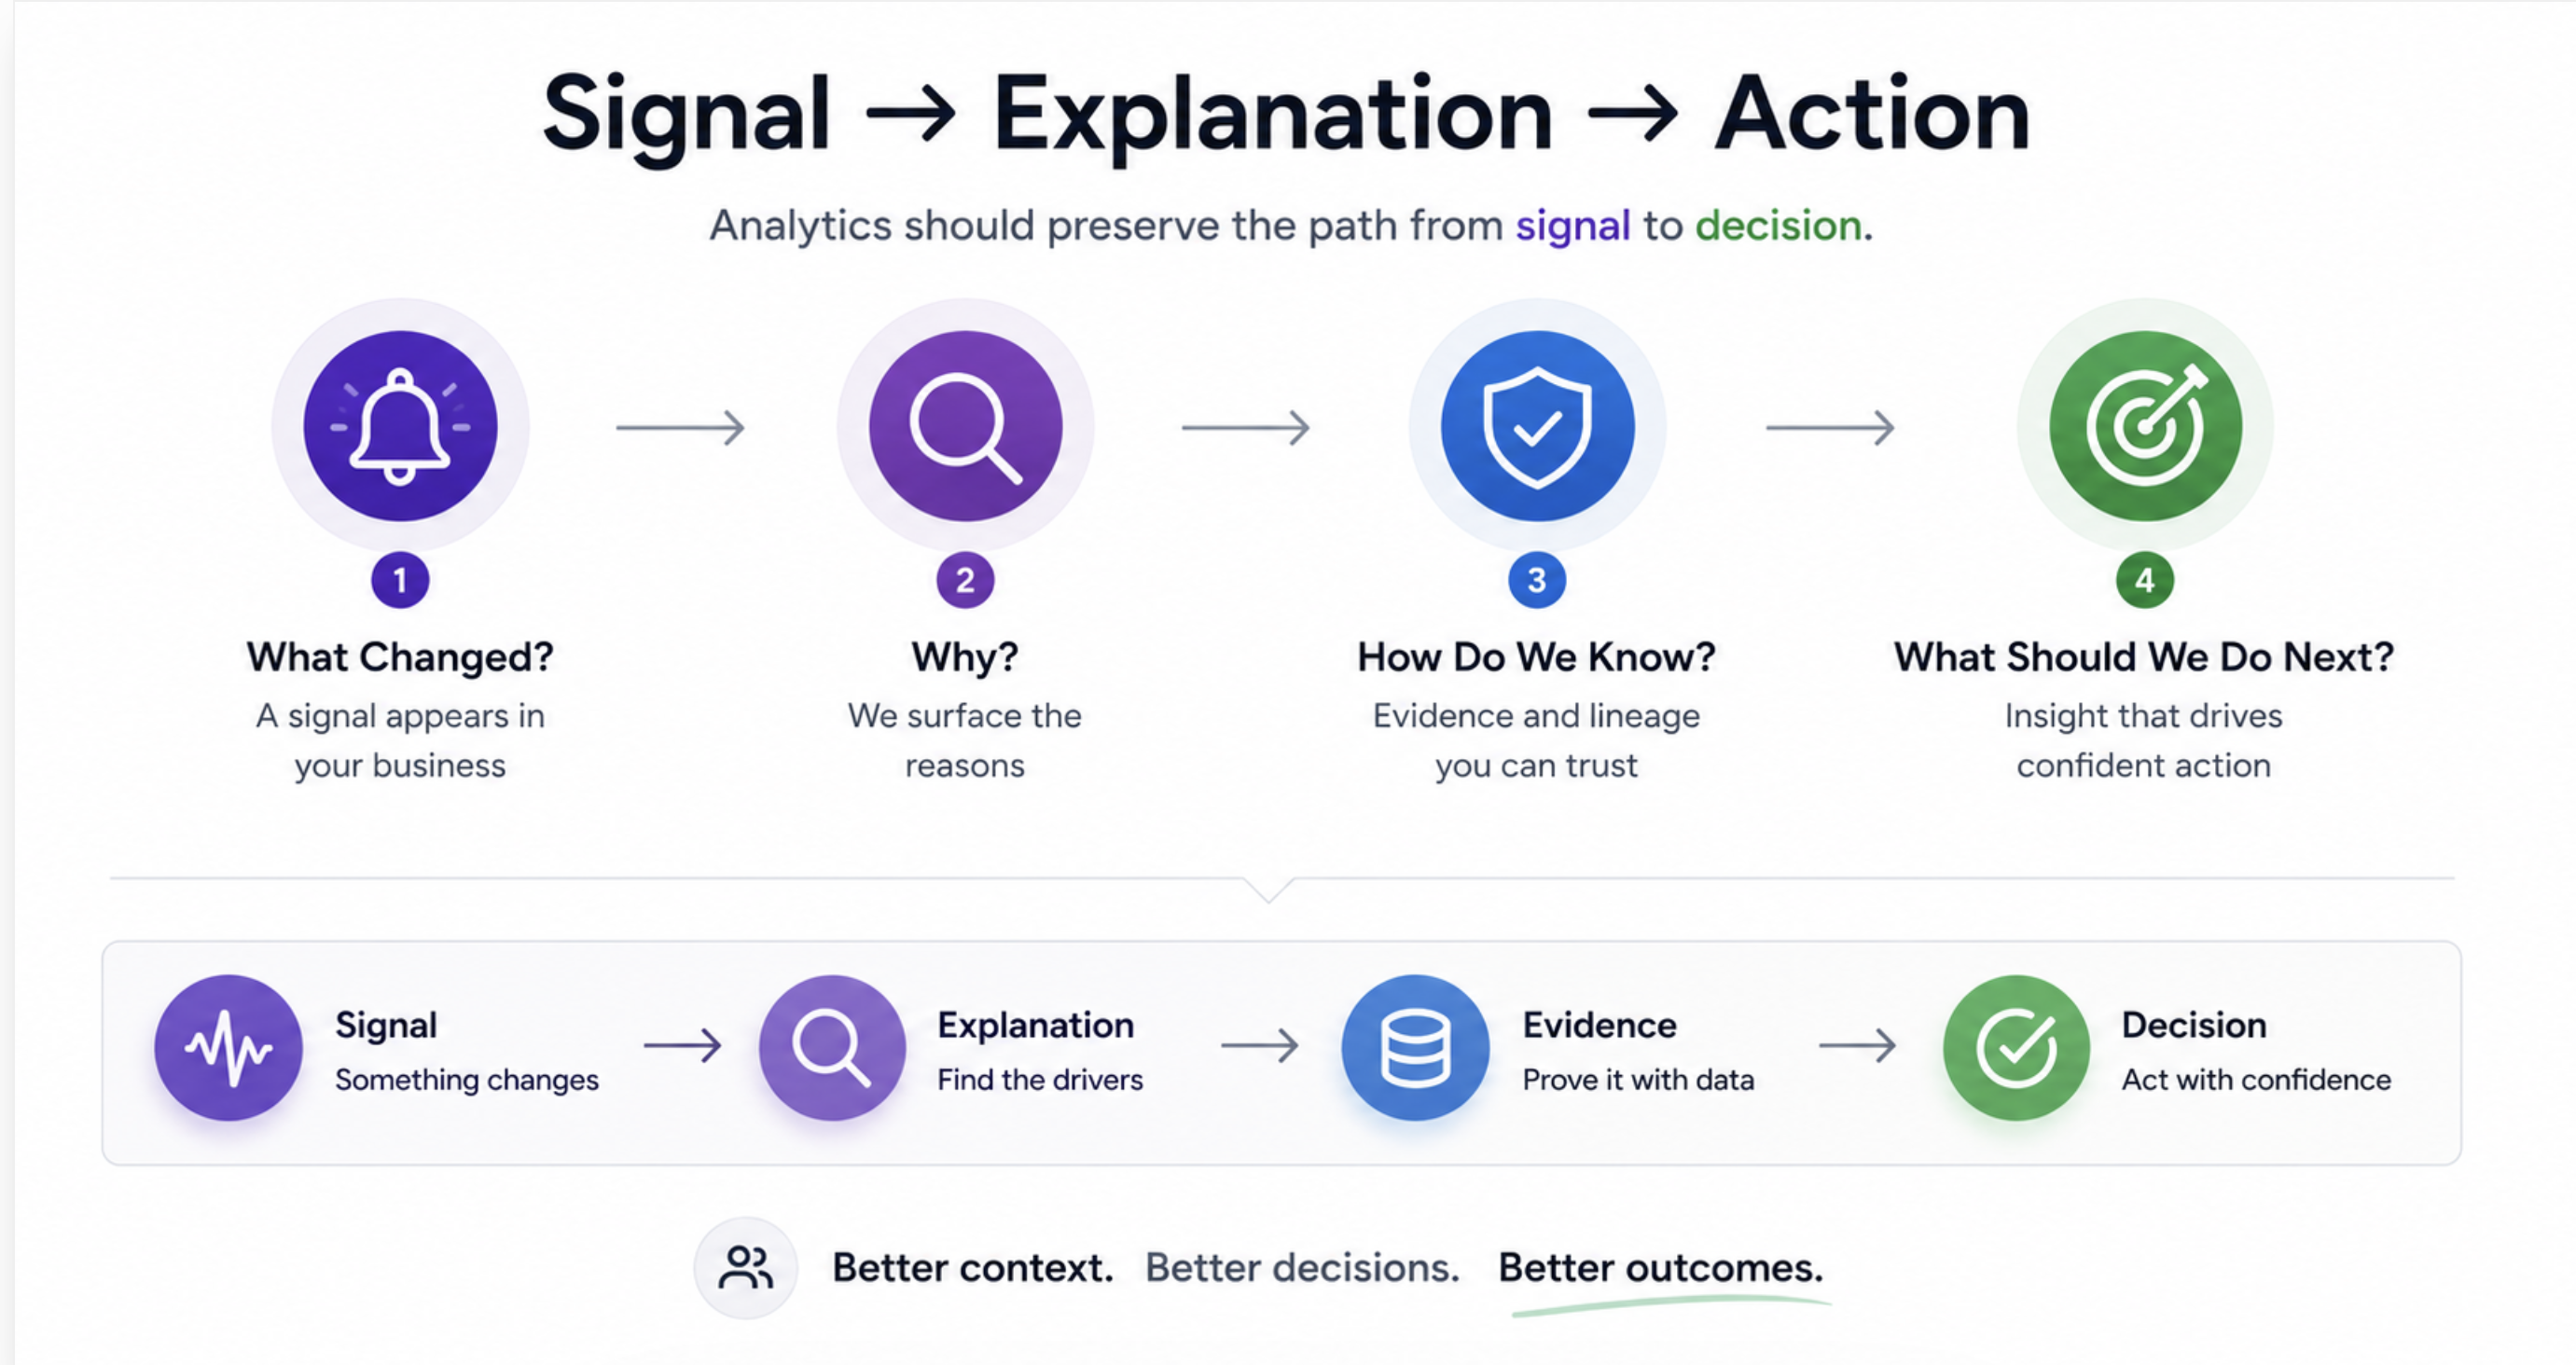
What changed?
Why did it change?
How do we know?
What should we do next?
A company does not become better at operating because it has more metrics.
It becomes better at operating when it can move from signal to explanation to action without rebuilding context from scratch every time.
That is the system I want Pollynate to become.
Not another dashboard.
A product for understanding.
Because most analytics products stop at the number.
The real job starts after the KPI changes.